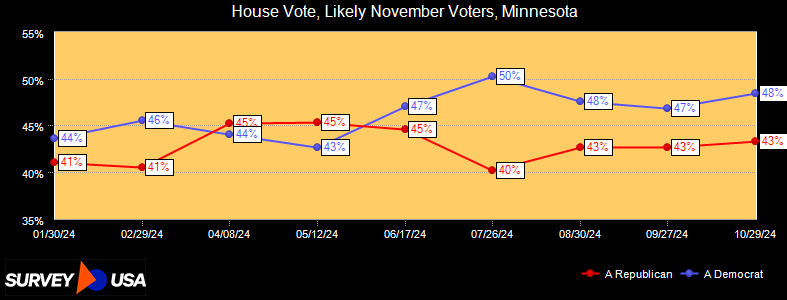
| All 134 Minnesota House seats are up for election in 2024. In the Minnesota House election in your district, are you generally more inclined to vote for a Republican? A Democrat? Or a candidate from another party? |
| TRACK POINTS | 01/30/24 | 02/29/24 | 04/08/24 | 05/12/24 | 06/17/24 | 07/26/24 | 08/30/24 | 09/27/24 | 10/29/24 |
| ± 2.8% | ± 3% | ± 4.9% | ± 4.3% | ± 4.5% | ± 4.4% | ± 4.5% | ± 4.3% | ± 4% |
| ALL | ALL | ALL | ALL | ALL | ALL | ALL | ALL | ALL |
| A Republican | 41% | 41% | 45% | 45% | 45% | 40% | 43% | 43% | 43% |
| A Democrat | 44% | 46% | 44% | 43% | 47% | 50% | 48% | 47% | 48% |
| Another Candidate | 3% | 3% | 3% | 4% | 1% | 2% | 2% | 3% | 1% |
| Undecided | 12% | 11% | 8% | 8% | 7% | 7% | 8% | 8% | 7% |
| Total | 100% | 100% | 100% | 100% | 100% | 100% | 100% | 100% | 100% |